Helligkeit, Schwarzwert, Kontrast
Die Messungen werden nach einer Kalibration auf D65 als Weißpunkt durchgeführt. Sofern möglich, werden alle dynamischen Regelungen deaktiviert. Aufgrund der notwendigen Anpassungen fallen die Ergebnisse geringer aus, als bei Durchführung der Testreihe mit nativem Weißpunkt.

Das Messfenster wird nicht von einem schwarzen Rand umgeben. Die Werte können daher eher mit dem ANSI-Kontrast verglichen werden und geben Realweltsituationen deutlich besser wieder, als Messungen von flächigem Weiß- und Schwarzbild.
Leuchtdichte Weiß
| Helligkeit | Nativ | D65 | 5800K | D50 |
| 100 % | 226,4 cd/m² | 225,5 cd/m² | 215,0 cd/m² | 203,9 cd/m² |
| 50 % | – | 128,0 cd/m² | – | – |
| 0 % | – | 25,5 cd/m² | – | – |
Leuchtdichte Schwarz
| Helligkeit | Nativ | D65 | 5800K | D50 |
| 100 % | 0,36 cd/m² | 0,36 cd/m² | 0,36 cd/m² | 0,36 cd/m² |
| 50 % | – | 0,20 cd/m² | – | – |
| 0 % | – | 0,04 cd/m² | – | – |
Mit nativem Weißpunkt erreichen wir eine maximale Leuchtdichte von knapp 230 cd/m². Das weicht deutlich von der Werksangabe ab, die 300 cd/m² vermerkt, und ist dem Wirkprinzip der Ausgleichsfunktion zur Verbesserung der Flächenhomogenität geschuldet. Dementsprechend erreicht der BenQ SW270C ein Kontrastverhältnis von lediglich gut 600:1.
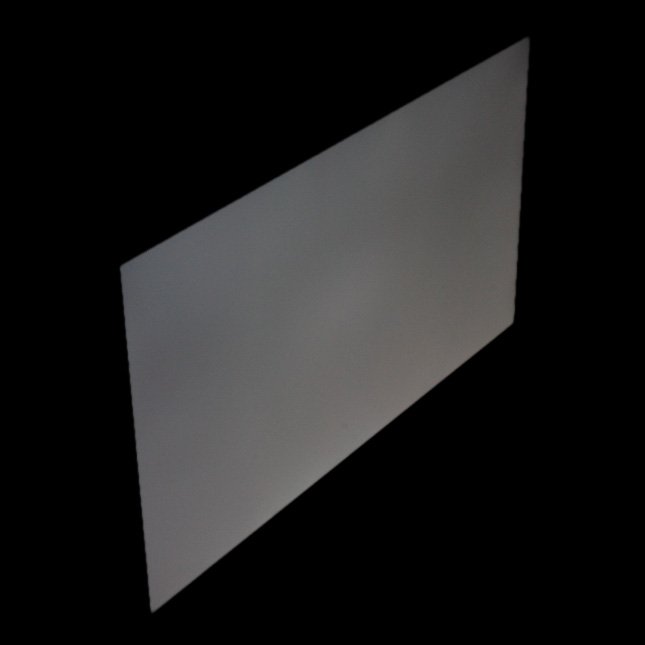
Blickwinkel
Die Werksangabe für den maximalen Blickwinkel liegt bei 178 Grad in der Horizontalen und Vertikalen. Die Angaben beruhen auf einem Restkontrast von 10:1. Das sind die für moderne IPS- und VA-Panels typischen Werte. Allerdings werden weitere farbmetrische Veränderungen nicht oder nur unzureichend in die Angabe einbezogen.
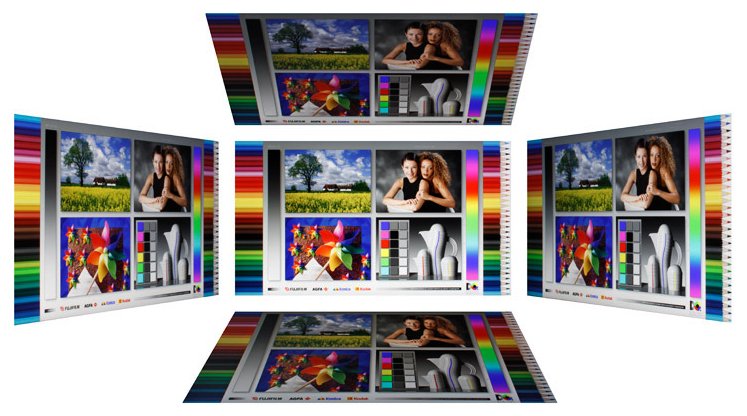
Das IPS-Panel des BenQ SW270C überzeugt durch seine hohe Blickwinkelstabilität. Farbton- und Gradationsveränderungen sind gegenüber Bildschirmen mit VA-Panel deutlich reduziert.


Diese Eigenschaften erlauben eine großflächige Anzeige farbkritischer Inhalte. Mit zunehmendem Winkel leidet vor allem der Kontrast, das Bild wird insgesamt flauer. Dunkle Tonwerte erscheinen stark aufgehellt. Der Effekt ist, abhängig vom Sichtabstand, bereits bei frontaler Betrachtung sichtbar. Diese Technologie-bedingte Schwäche kann derzeit nur durch das Aufbringen spezieller Polarisationsfolien abgemildert werden.
Farbmetrische Tests
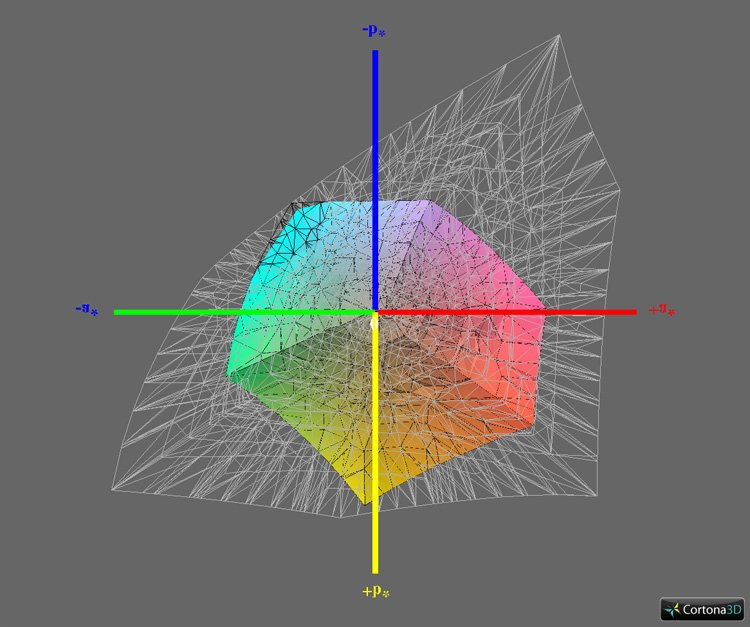
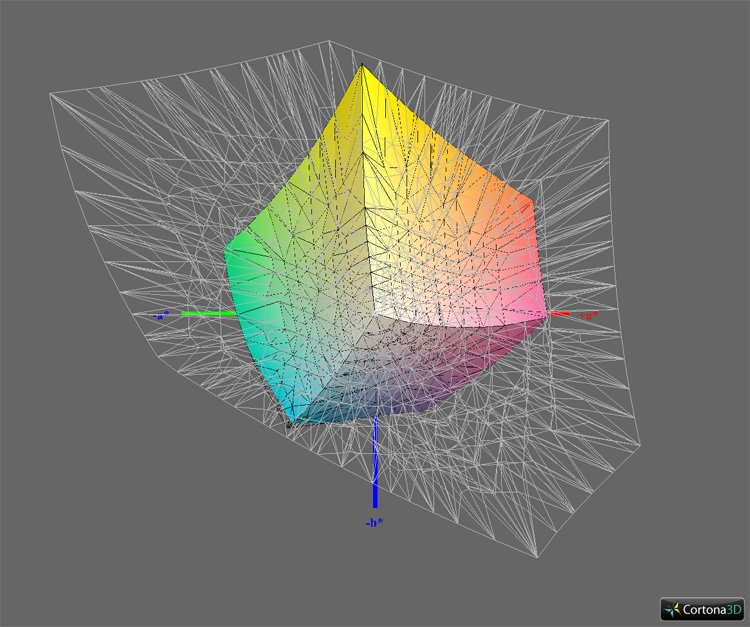
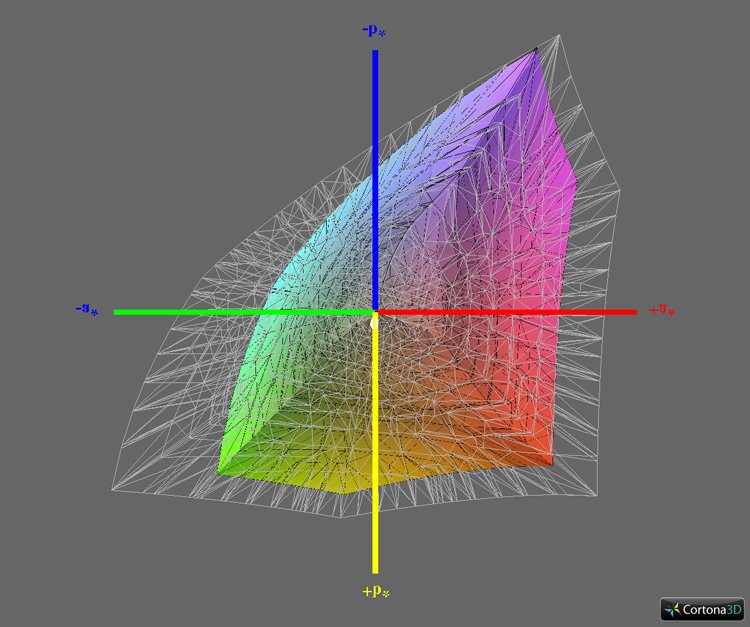
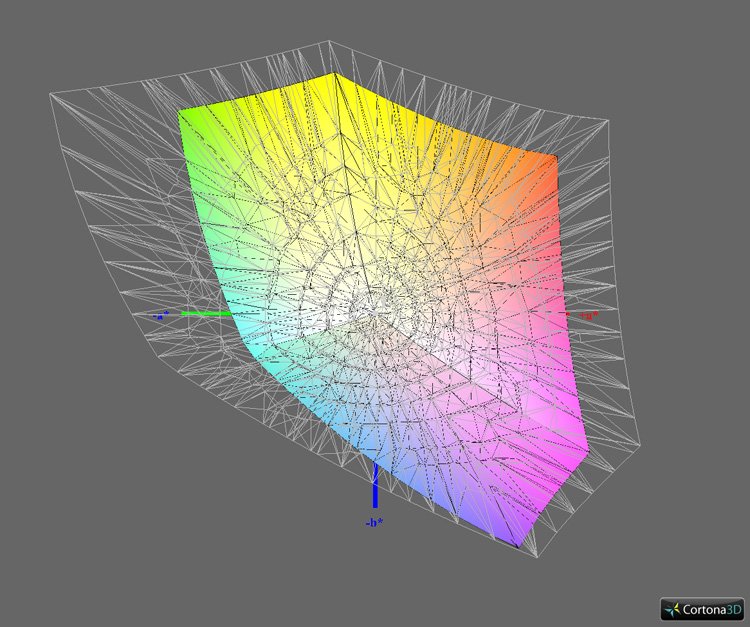
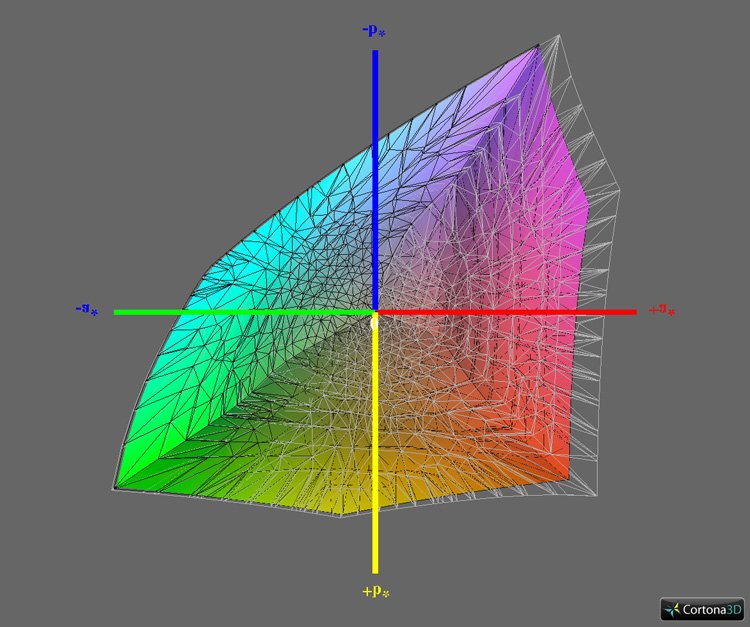
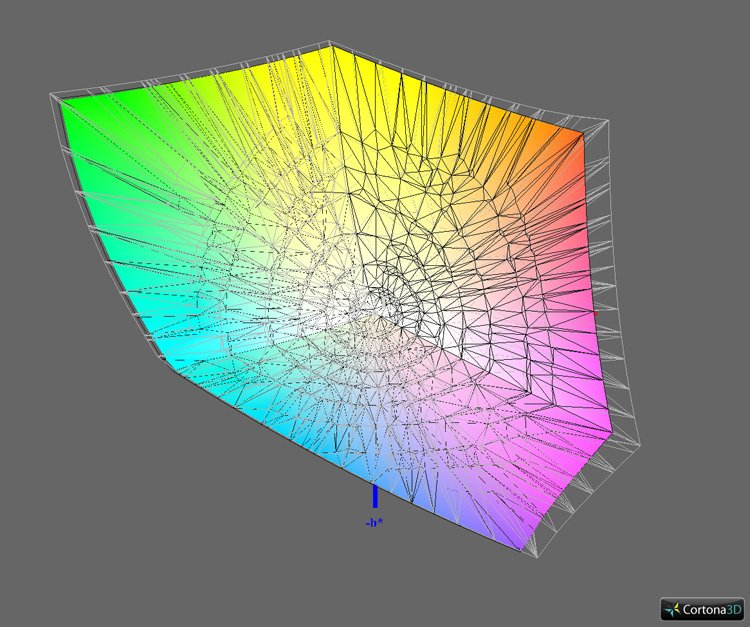
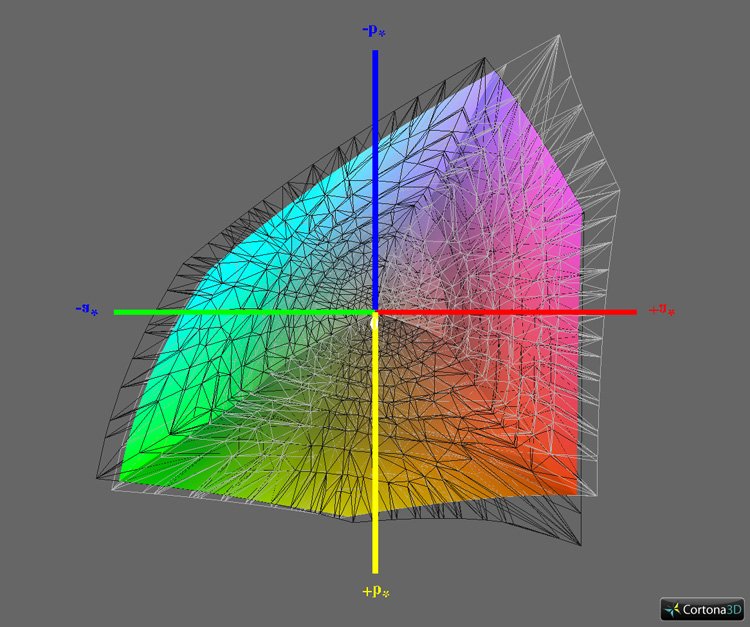
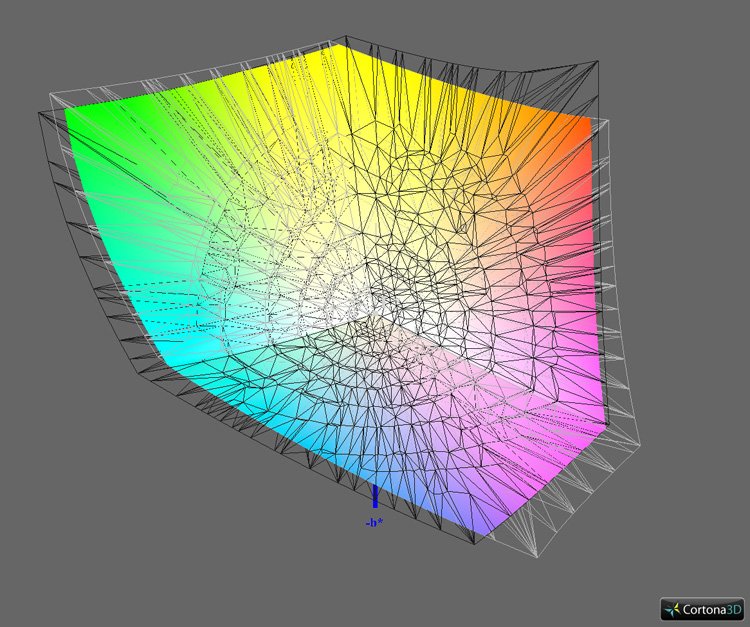
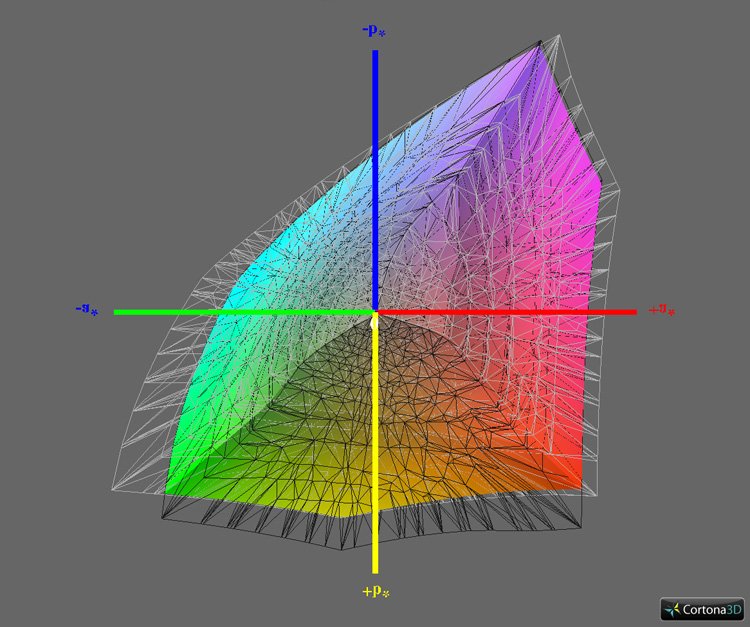
Farbraumvergleich in CIELAB (D50)
Die folgenden Darstellungen basieren auf den farbmetrischen Daten nach einer Kalibration auf D65 als Weißpunkt. Das Bezugsweiß für die Aufbereitung in CIELAB ist D50 (adaptiert mit Bradford).
Weißes Volumen: Bildschirmfarbraum
Schwarzes Volumen: Referenzfarbraum
Buntes Volumen: Schnittmenge
Vergleichsziele: sRGB, Adobe RGB, ECI-RGB v2, ISO Coated v2 (ECI), DCI-P3 RGB
| Farbraum | Abdeckung im Werks-Preset |
| ISO Coated v2 | 99 % |
| sRGB | 99 % |
| Adobe RGB | 98 % |
| ECI-RGB v2 | 88 % |
| DCI-P3 RGB | 90 % |
sRGB und Adobe RGB werden fast vollständig abgedeckt. Präzise kann auch die durch die FOGRA39-Charakterisierungsdaten beschriebene Offset-Druckbedingung reproduziert werden. Damit sind aussagekräftige Proof-Simulationen möglich.

Messungen vor Kalibration und Profilierung
Dynamische Regelungen werden, sofern möglich, vor den nachfolgenden Tests deaktiviert.
Werkseinstellung
Die ausführlichen Testergebnisse können als PDF-Datei heruntergeladen werden.


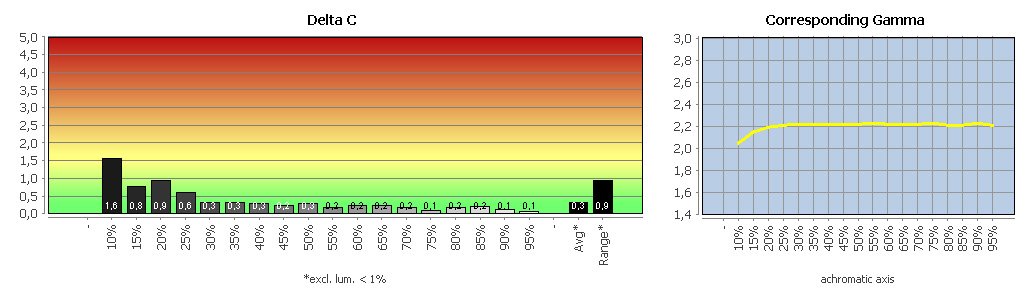
Die Werkseinstellung des BenQ SW270C, basierend auf dem Adobe-RGB-Farbmodus, überzeugt. Alle von uns erfassten Parameter korrelieren gut mit den jeweiligen Einstellungen im OSD. Die Graubalance ist ausgezeichnet. Leider ist die Farbraum-Emulation auch im benutzerdefinierten Farbmodus zwangsaktiv. Erst im Rahmen der Hardware-Kalibration kann der native Farbumfang genutzt werden.
Der benutzerdefinierte Farbmodus offenbart einen weiteren kleinen Fauxpas: Nach Rücksetzung in die Werkseinstellung befinden sich Farbton- und Sättigungsregler nicht in Neutralstellung. Das führt zu unnötigen, wenn auch geringen, Nichtlinearitäten (der Begriff bezieht sich nicht auf eine lineare Tonwertkurve, die nie angestrebt wird).
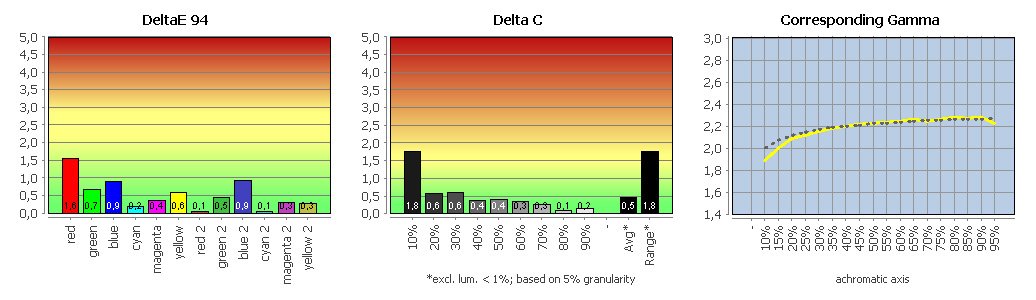
Zur besseren Illustration haben wir den BenQ SW270C nach Rücksetzung in die Werkseinstellung sowie Auswahl des benutzerdefinierten Farbmodus vermessen und aus den Ergebnissen ein einfaches Shaper-Matrix-Profil erstellt. Aufgrund seines Aufbaus eignet es sich hervorragend, um in einem anschließenden Soll-Ist-Vergleich (Profilvalidierung) Schwächen in der Verarbeitung durch die Scaler-Pipeline offenzulegen.
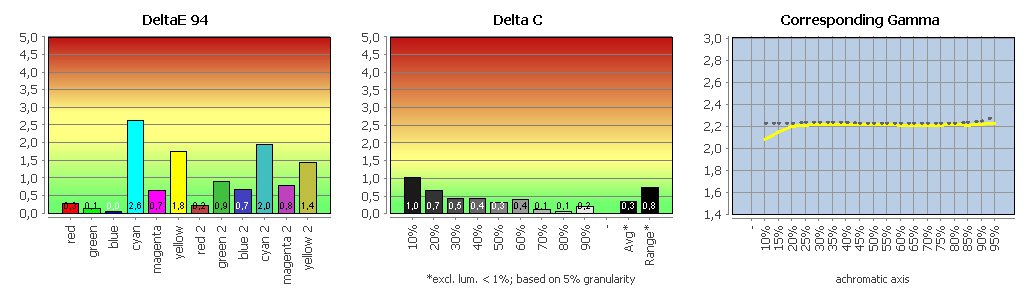
Profilvalidierung nach Rücksetzen in die Werkseinstellung.
Die ausführlichen Testergebnisse können als PDF-Datei heruntergeladen werden.
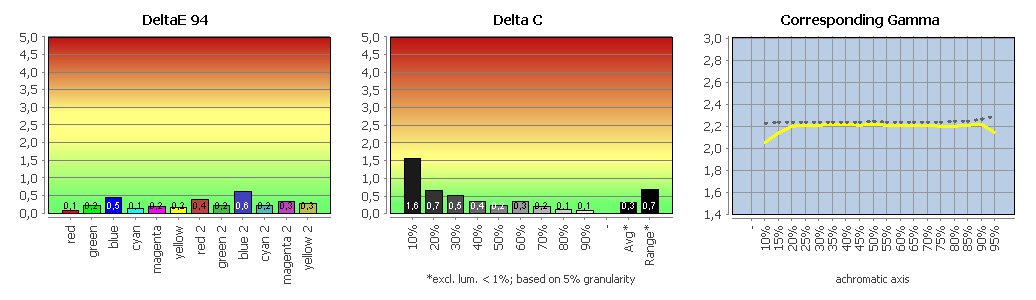
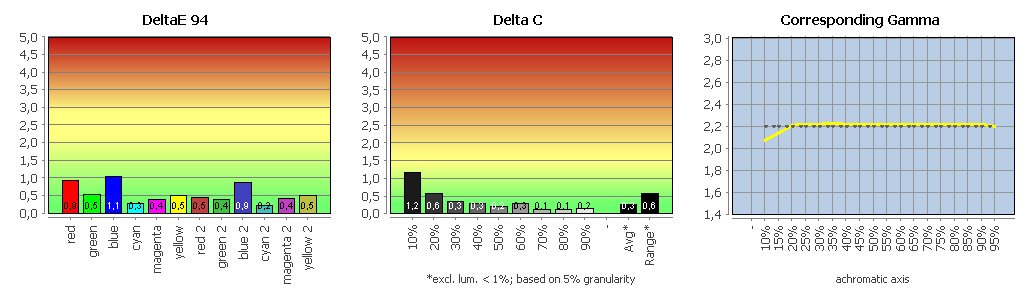
Profilvalidierung nach Rücksetzen in die Werkseinstellung sowie anschließender Korrektur der Farbton- und Sättigungseinstellungen.
Die ausführlichen Testergebnisse können als PDF-Datei heruntergeladen werden.
Anwender, die den BenQ SW270C im benutzerdefinierten Farbmodus betreiben möchten, sollten Farbton- und Sättigungseinstellungen daher unbedingt kontrollieren und gegebenenfalls manuell zurücksetzen.
Farbmodus sRGB im Vergleich mit sRGB
Die ausführlichen Testergebnisse können als PDF-Datei heruntergeladen werden.
Farbmodus Adobe RGB im Vergleich mit Adobe RGB
Die ausführlichen Testergebnisse können als PDF-Datei heruntergeladen werden.
Über den sRGB- und Adobe-RGB-Modus können wir wiederum fast ausschließlich positiv berichten. Die Graubalance ist weiterhin einwandfrei. Geringe Abweichungen in den bunten Farben zeugen von präzisen Farbraumtransformationen. Entsprechende Inhalte können damit bereits ohne weitere Maßnahmen sehr ansprechend auch in nicht Farbmanagement-fähigen Anwendungen wiedergegeben werden.


Hallo 🙂
Mein neuer Monitor (BenQ PhotoVue Monitor SW270C) flackert beim ersten Mal sehr komisch. Habe heute zum ersten Mal meinen Macbook 2016 angeschlossen und wenn ich z.b Photoshop aufmache, sehe ich überall kleine weiße flackernde Punkte :/ Muss irgendwie gleich am Anfang eine Kalibrierung stattfinden?
Tausend Dank im Voraus!
Hallo,
habe mir den Monitor nach dem Test hier geholt und bin etwas zwiegespalten. Wenn man frontal auf den Monitor schaut ist die Ausleuchtung an den Rändern heller und ab den Rändern sind schmale dunklere Streifen. Keine Ahnung, ob das „normal“ ist. An einem anderen 27″ Monitor (HP Z Display Z27) habe ich das nicht gesehen, der ist dann natürlich auch nicht so „farbecht“ wie der Benq. Wenn man beim Benq direkt auf die Ränder schaut ist das Bild wieder gleichmäßig ausgeleuchtet. Aber ich sitze ja normalerweise mittig vor dem Monitor.
Eine weitere Anomalie: Wenn ich neustarte erkennt der Monitor das Signal manchmal nicht und ich muss, um wieder ein Bild zu bekommen, komplett den Stecker ziehen, warten und dann wieder einstecken. Würde mich über Erfahrungsberichte freuen.
Grüße!
Fabian
Hängt der Monitor an einer schaltbaren Steckdosenleiste? Mal ohne probieren. Wenn der Randbereich bei frontaler Sicht korrekt ist, könnte das IPS-Glow sein.
Hello,
I would like to second a question above about FRC – first, is this a true 10-bit panel, or a 8-bit+FRC panel? If it is a true 10-bit panel, what would give less flickering – the true 10-bits of this panel and the high-frequency PWM it has, or the total lack of PWM combined with with the flickering from 8-bit+FRC as in ViewSonic VP2785-2K. I am trying to choose between these two models, and find a balance between flickering and half-tone capabilities.
Hallo, Hat dieser Monitor wirklich Pulsweitenmodulation (PWM)? In anderen Quellen stehen dazu wiedersprüchliche Angaben, zudem haben ja schon die „kleineren“ Monitore von BenQ fast ausschliesslich kein PWM. Danke für die Klarstellung.
Deshalb messen wir ja. Was soll ich Du Deiner Frage sagen, das steht ja im Test.
Wie gesagt andere englischsprachige Seiten behaupten, dass es sich um einen Monitor ohne PWM handelt. Darum die Frage. Ich wollte damit keinen auf den Schlips treten. Und ich finde das nachhaken durchaus berechtigt.
Nachfragen ist ok und ich fühle mich auch nicht auf den Schlips getreten. Aber unser Messlabor hat PWM festgestellt. Zwar mit einer Frequenz wo niemand mehr ein flackern wahrnimmt, aber dennoch PWM. Das Gerät geht nach der Messung an den Hersteller zurück. Ich kann deshalb nichts anderes dazu sagen. Unsere Messmethode zeigt PWM. Wir haben nur eine Methode wie wir messen und das seit Jahren. Dass hier falsche Werte ausgelesen wurden sehe ich als sehr gering an. Einen Fehler kann ich aber auch nicht zu 100 % ausschließen, gehe aber nicht davon aus.
Was ist die Hz-Frequenz PWM?
Immer nach der Kalibrierung mit Palette Master Element ist das Bild kühler als es im Vor kalibrierten zustand ist (Srgb). Auch der Bildschirm den ich vorher hatte (Software kalibriert) kam näher an die Werkseinstellungen des Benq ran. Ist das Normal? Kalibriert wird mit dem Spyder5 Pro.
kam mir beim sw 320 immer auch so vor. Vor allem wenn ich parallel dazu ein NEC PA242 SV simultant kalibrierte und daneben stellte. Der Benq wies dann auf eine zwar feine, aber doch wahrnehmbare violet- rötliche Anmutung.
Was ist die Frequenz des Hintergrundlichts bei der Hälfte der Helligkeit?
Wir messen bei 140 cd/m². Daher kann ich Dir das nicht sagen.
Hello, What about frc, does flashing color tones at different speed cause slow flickering at low frequencies?
hello, what kind of monitor can you recommend more for occasional photo editing. BenQ SW270C or EIZO EV2785? Thank you Olda
Hello Santokki,
unfortunately in this case, due to an error, no spectral data was saved. What I can say from here is that it should be quite similar to GB-r-LED spectrum which also manifests in obtaining a very good matching between i1 Display Pro measurement with GB-r-LED edr and reference measurement.
Palette Master Elements is not able to use GB-LED correction for i1displaypro… it is not available. Benq, LG and Samsungs use a *wrong* correction for all their widegamuts and their HW calibration solutions: RGB LED, with a distinctive signature in red channel. So PME is not able to measure properly that SW270C GB-LED, or other SW like SW2700PT and its QLED or SW240 and its PFS phosphor.
It’s easy to test, look in PME folder and see the missing EDRs.
Viewsonic & Dell have GB-LED corrections in their software. Dell has a P3 version of PFS phosphor displays so that can match red channel in those PFS displays but fail at green by a little in their UP displays that cover a very big amount of AdobeRGB and P3, something about 97% or more.
If you can get a good match in witepoint using PME and then validating with an i1displaypro and prad’s testing software using a GB-LED reference it is caused by colorimeter data stored in firmware (spectral sensivities). They should be close to standard observer in spectral regions where PME’s reference and actual reference dift apart *for that unit*.
Other units of the same model can behave worse and they shouldn’t if benq used a proper spectral correction in their software. I mean, i1displaypro instrument variability is solved by each colorimeter storing its own spectral sensivities in firmware, so they can „auto-correct“ using spectral correction references, without an spectrophotometer to compute a correction taylor made for them. But this huge advantage of that colorimeters needs that manufacturers suppli a set of spectral corrections suitable for their displays… and Benq does not provide them in a proper way.
> If you can get a good match in witepoint using PME and then validating with an >
> i1displaypro and prad’s testing software using a GB-LED reference
There was a misunderstanding: My comment refers to using a generic GB-r LED spectral characterization and remeasurement with i1 Pro – not using the characterization actually used by Palette Master.
However, with its 10nm optical bandpass, the i1 Pro is of course limited too when it comes to narrowband spectra. The aggregation will always lead to significant averaging effects. Using the native sampling (e.g. with the Argyll driver) does not resolve this.
Another thing to keep in mind is the enormous impact of observer metamerism. E.g. in a typical environment of matching softproofs to the actual prints, a visual match between paper white and proof simulation has to be carried out to determine calibration whitepoint – not a measurement based match (see also the comments in ISO 14861). Remeasuring this condition with a reference instrument will lead to a dE *well* beyond 10. An error of this magnitude will already occur when visually matching a non WCG to a WCG screen. Using the 10 degree oberserver only slightly lessens this. The 2 degree standard observer has some systemic erros, but is mostly limited (like every other CMF) by the person-to-person deviation. The relexion spectrum of surface colors is unproblematic, but a small difference between normative CMFs and individual CMFs in the area of a spike will sum up to big deviations in the evaluation.
Considering this (+ the color constancy of the human eye) an absolute error (too a certain degree) gets less horrifying.
After looking at the report again, I have to correct my previous post. Indeed a calibration with PME + i1 Display Pro and remeasurement out of our software and the GB-r-LED edr was carried out, with target whitepoint D65 (colorimetric).
Result (target whitepoint vs. remeasurement):
i1 Pro: dE = 2.1
i1 Display Pro (Retail; GB-r-LED edr): dE = 0.2
i1 Display Pro (OEM; GB-r-LED edr): dE = 0.8
There is no technical difference between OEM and retail probe, just to distinguish between the two probes used during this test.
For reference here the result with default channel correction:
i1 Display Pro (Retail): dE = 3.3
i1 Display Pro (OEM): dE = 4.4
Back to the probe: While its CMF tracking is not bad overall (especially for a 3 filter device in this price-class), measuring narrowband emissive spectra can still lead to considerable errors in disadvantageous constellations (see also previous post). The mechanism of using known individual filter characteristics of the actual probe in combination with the spectrum to be measured (to build up correction coefficients) is a solid countermeasure. Therefore I can understand your reservations when BenQ is using data that is not an absolute precise match for the backlight used. And certainly only two probes is no valid mass test.
However, uncertainties are generally present. The more generic character of the edr files, fluctuations in SPD, precision of filter characterization. Each factor alone is capable of producing a quite big error even in an appropriate use case – in theory. In practice it works overall very well; and in this case even the default channel correction is not too bad.
I once accomplished a small mass test of all i1 DisplayPro at our disposal (6 devices), averaging over different displays (CCFL, WCG-CCFL, W-LED, GB-r-LED, RGB-LED; edr chosen accordingly) and ended with an inter-instrument-agreement of dE ~ 0.7, with a maximum deviation of dE ~ 1.3 (max. dE not averaged over the displays ~ 2.3).
Using only the default channel correction, the inter-instrument-agreement still was acceptable for 5 probes. One was off by dE~6 in maximum (WCG spectra). A proof for the individual characterization but it underlines that unfavourable conditions can occur.
Long text, short summary: Yes, of course BenQ should use the edr which is closest to the SPD of the screen – and in best case even integrate an edr for the actual panel used. But in the end it’s more an academic question. General constraints of CMF based colorimetry (measuring like seeing – that’s a noble goal) should not be underestimated. If constructing a scenario with multiple monitor matching or matching to other external stimuli, these will kick in mercilessly and one will end up with visual matching the target anyways (like the softproof example). That’s why I thank you for pointing out the missing gb-led edr – but still see most of the optimization potential for these screens in other areas.
What if one takes an „RG_Phosphor_Family_25Jul12.edr“ and copies it into the PalleteMaster directory? Would PME use it or maybe use it if renamed to „RGBLEDFamily_07Feb11.edr“ (as this is the one normally used)? Would PME therefore use the correct „GB-LED.edr“?
Hello, can you offer color spectrum (Spektrale) picture of SW270C?
Very curios about it. review contents only mention it, but no pic.
Always thanks for such good monitor review.